
From Vision to Victory: Harnessing the Power of SMART Metrics to Drive Results
What is the primary reason behind the failure of more than 45% of projects? The difficulty of aligning business and project objectives consistently. Addressing this issue involves asking critical questions: How can you bridge the gap between goals and execution? How can you ensure your project aligns with business objectives and achieves the desired outcomes? Leveraging data analytics for informed decision-making becomes the cornerstone of success. Therefore, investing time and effort to define, measure, and analyze project metrics is essential for driving results and sustaining alignment with broader organizational goals.
Introduction
Effective project management requires setting clear goals and monitoring progress consistently. According to the Project Management Institute (PMI), a project is defined as a temporary effort aimed at producing a unique product, service, or result. Project managers can use metrics to measure and evaluate if the resources and investments directed towards a project have produced the desired outcomes. By establishing these metrics from the onset, project managers can track progress, identify potential issues early on, and make informed decisions to ensure the project aligns with its objectives. Furthermore, the practice of tracking metrics is essential for ensuring transparency, accountability, and alignment throughout the duration of a project.
SMART metrics—those that are Specific, Measurable, Achievable, Relevant, and Timebound—make up a fundamental framework for developing goals that are both actionable and measurable. This article outlines the best practices for formulating SMART metrics and emphasizes the importance of monitoring metrics within the context of project management.
The Importance of Tracking Metrics in Project Management
Why Tracking Metrics Matter
Tracking metrics is far more than a routine managerial task—it is a vital cornerstone for project success. By systematically monitoring metrics, businesses gain a clear understanding of their performance and resource utilization. Specifically, organizations can benefit from metric collection and analysis by:
Progress Monitoring: Metrics offer measurable data that enable businesses to analyze their progress and pinpoint strengths and weaknesses. Metrics help in determining whether the project is proceeding as planned or diverging from its intended path.
Data-Based Decision-Making: By analyzing metrics, businesses can make informed decisions regarding resource allocation, strategic adjustments, and process improvements. Decisions based on insights derived from quantifiable data collection and analysis ensure that discussions, feedback, and actions are objective and impartial.
Drives Accountability and Enhances Team Performance: Metrics assign measurable responsibilities to team members, promoting a culture of accountability. When teams achieve quantifiable targets and share the results in real-time, their success often improves. Project managers and organizations typically see better performance when it is tracked, shared, and celebrated.
Enhances Stakeholder Confidence: Regularly sharing measurable progress keeps stakeholders well-informed and fosters trust. When organizations diligently track and respond to metrics for continuous growth and improvement, it enhances stakeholder confidence in the organization and the project team’s commitment to success.
Improve Customer Perception and Loyalty: Improving customer perception and loyalty involves collecting and analyzing customer behavior data, such as satisfaction, engagement, and loyalty. This helps businesses understand and meet customer needs and preferences, ultimately leading to better products and services.
Optimization: Tracking metrics effectively identifies inefficiencies and bottlenecks proactively, enabling businesses to optimize operations and improve efficiency. This method supports risk and opportunity management, as well as corrective and preventive action processes, which are essential to continuous improvement.
Goal Achievement: By monitoring progress against key metrics, businesses can ensure alignment with their strategic goals. Utilizing past performance and industry benchmarks as a baseline, data-driven metrics enable organizations to set realistic objectives. Tracking metrics such as Return on Investment (ROI) allows businesses to evaluate the effectiveness of their investments and make informed decisions regarding future expenditures.
Best Practices for Tracking Metrics
Effectively tracking metrics requires a deliberate and intentional approach. Organizations should avoid tracking metrics as a performative function or for appearances or without clear purpose and objectives. Instead, metrics should be collected thoughtfully, reviewed regularly, and acted upon meaningfully. Below are some key guidelines for making the most of your metrics:
Define SMART Metrics: Identify the most critical SMART metrics that align with your project goals and organizational strategy.
Leverage Technology: Utilize project management tools, dashboards, and analytics software to automate data collection and create clear impactful visualizations.
Establish a Reporting Routine: Regularly review metrics with your team and stakeholders to ensure their relevance and feasibility. Frequent updates help keep everyone informed and aligned, fostering engagement and participation.
Analyze and Interpret Data: Go beyond surface-level averages and counts by diving deeper into trends, patterns, insights, and forecasts. This provides a clearer picture of success rates and how well the metrics support organizational goals.
Adapt When Necessary: Stay flexible by adjusting metrics to respond to changing priorities or evolving project needs and organizational strategies.
Act When Needed: Gathering and analyzing metrics is just the beginning. Organizations need to act on insights by reallocating resources, correcting deviations, or driving improvements.
What Are Project Management Metrics?
Are performance metrics the only lens through which project success can and should be measured? It is important to recognize that project metrics are far from a one-size-fits-all solution. While performance metrics often take center stage, they represent just one facet of a broader framework. The reality is, projects are multifaceted, and the metrics used to assess their success should capture that complexity. Think of metrics as different lenses, each offering unique insights into the project's progress and overall health. Together, these metrics create a comprehensive view that extends well beyond mere performance outcomes, embracing the full scope of the project's journey. Project metrics should encompass business and operational impacts, as well as social and customer impacts. This broader perspective facilitates a comprehensive evaluation of the project's overall return on investment and validates the project’s value proposition. Lets explore the wide array of project metrics that are critical to measuring the success of project outcomes.


Understanding SMART Metrics
What Are SMART Metrics?
SMART goals are designed to address all key functions, processes, and deliverables. The purpose of goals is to direct attention and resources towards what is most important in order to successfully achieve project objectives and priorities. SMART metrics help ensure that objectives are both ambitious and practical, allowing teams to track progress effectively while staying aligned with broader priorities. The method ensures that the metrics are:
Specific: The goal must be clearly defined and unambiguous, outlining what is being pursued, why it matters, who is responsible, where it will be tracked, when to measure progress, how it will be evaluated, and which tools will be used. The objective should outline the steps required to achieve the targets.
Measurable: Progress toward goals must be assessed using clear, quantifiable data or indicators. This approach transforms subjective ambitions into concrete objectives, enabling fair and impartial evaluations of success. Measuring progress with precision provides project teams early warnings about lags or leads, allowing swift action and effective resource allocation to ensure targets are met.
Achievable: Goals should be challenging yet achievable, striking a balance between ambition and realism. Establishing realistic targets within current resources and constraints helps maintain focus and prevent discouragement. The goals are meant to inspire motivation rather than overwhelm them. Many projects and organizations also incorporate “stretch goals” — ambitious benchmarks to strive for once primary objectives are achieved.
Relevant: Relevance emphasizes focusing on actions that align with broader business goals and organizational priorities. This ensures every effort contributes meaningfully to strategic objectives. SMART goals are designed to measure progress towards achieving organizational growth or improvement. Common types of goals include:
Creating or producing something new
Improving quality of goods and services
Increasing performance or output
Enhancing or refining existing processes
Reducing inefficiencies and waste
Saving time or resources
Developing or empowering team members
Timebound: Goals should have a clear deadline or timeframe for completion, ensuring that progress and achievements are measured within this designated period. This approach fosters a sense of urgency and prioritization, helping allocate adequate resources and drive timely action. The timeframe encompasses the start and end of the endeavor, as well as intervals for assessing metrics throughout its lifespan. Having a definitive end date instills motivation in team members, providing them with the reassurance of a tangible target and preventing the demoralization caused by perpetual measurement with no conclusion in sight.
Using SMART metrics ensures that goals are not only aspirational but also attainable and measurable, providing a roadmap to successful project completion. Here are a few examples of SMART metrics for various domains:
Sales: "Increase monthly sales revenue for Product A by 15% over Q2FY23 through targeted sales and marketing campaigns."
IT: "Reduce system downtime to less than 1% by implementing infrastructure upgrades and cloud migration by Q2FY24."
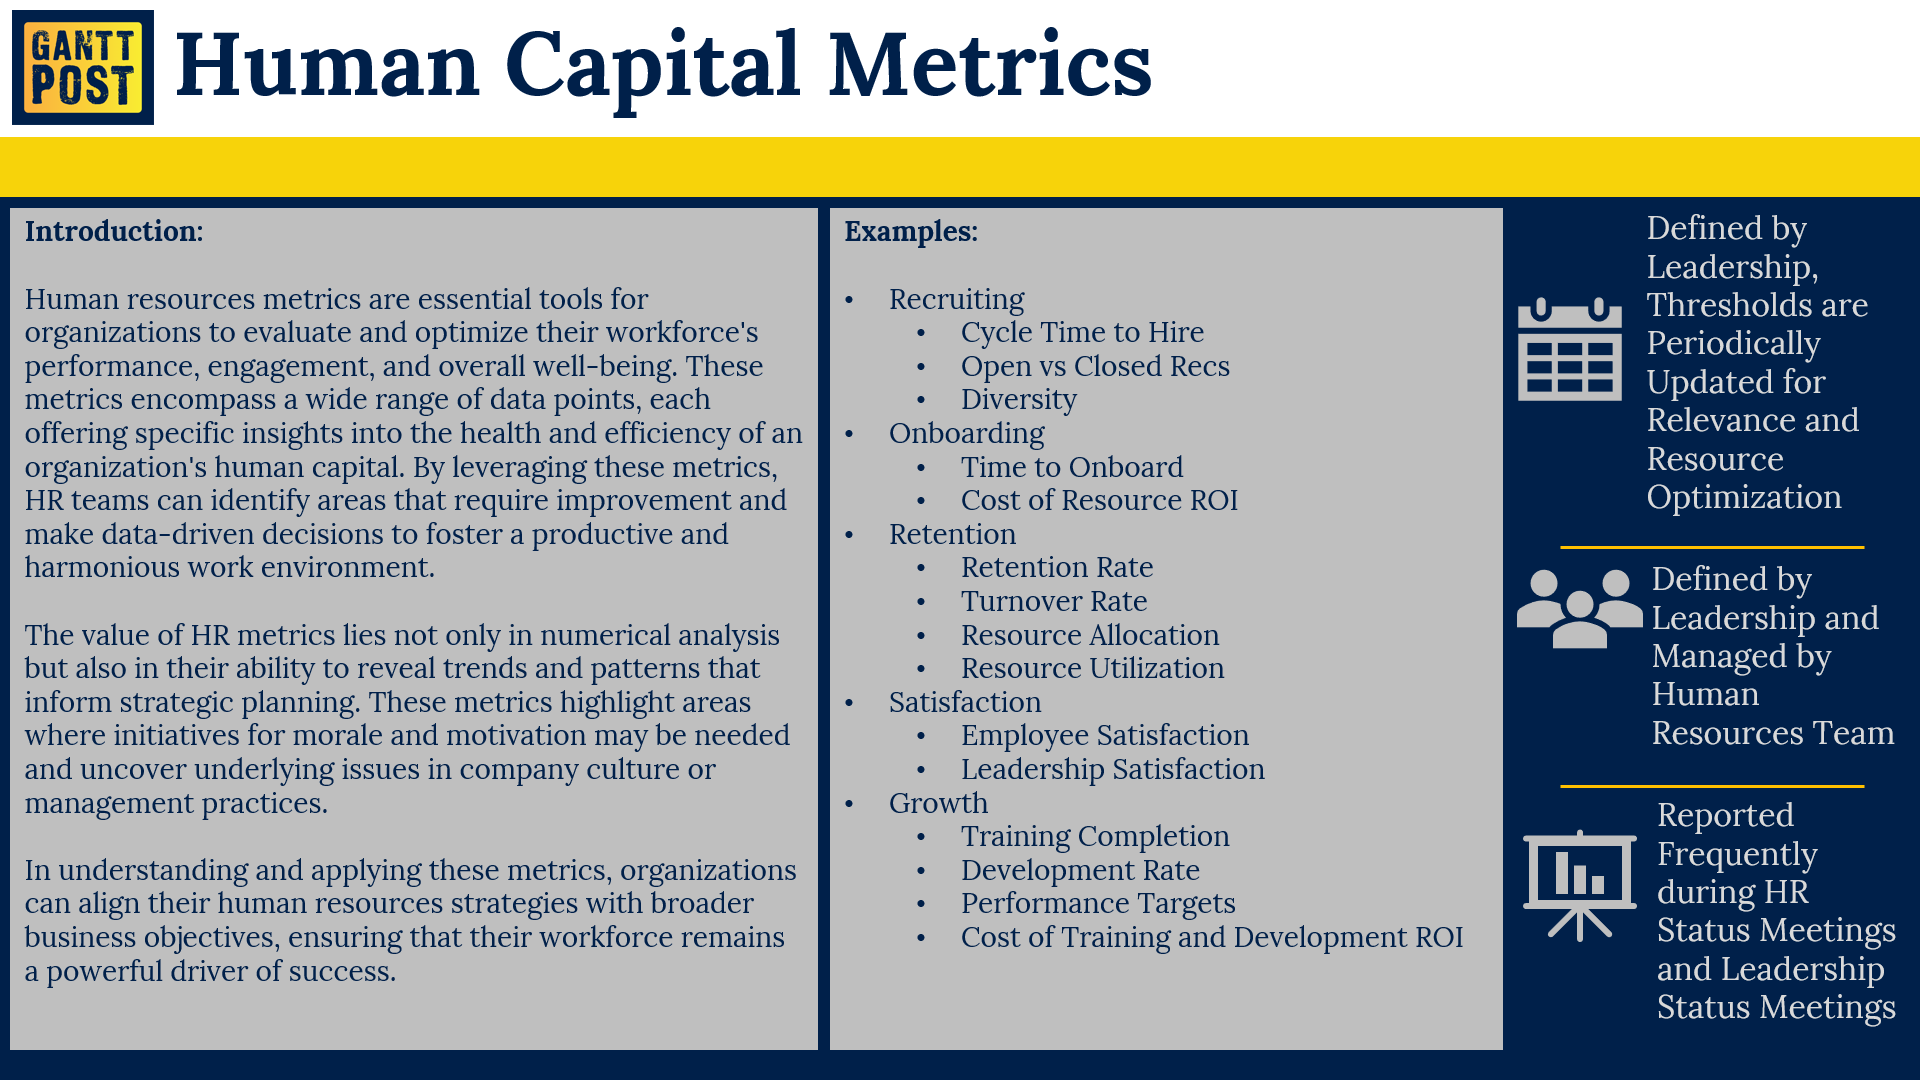
Human Resources: "Hire and onboard five qualified software engineers by Q1FY25 to support the upcoming project kickoff."
Marketing: "Achieve 10,000 unique website visitors per month by the end of FY2025 by enhancing SEO strategies."
What is the Difference Between BSC vs KPIs vs OKRs?
The Balanced Scorecard (BSC), Key Performance Indicators (KPIs), and Objectives and Key Results (OKRs) are distinct frameworks, each tailored to specific aspects of goal setting, performance management, and strategic planning. While they share common goals such as creating alignment, measuring progress, and enhancing performance, they differ significantly in their application and focus.
BSC is primarily a strategic planning and management system. It offers a comprehensive way to outline and manage organizational strategy. BSC emphasizes creating alignment across multiple perspectives, prioritizing initiatives, and improving strategic performance. At its core are objectives and measures, which provide a structured approach to translating strategy into actionable goals. Its broader focus on planning and alignment makes it particularly valuable for overarching organizational strategies.
Key Performance Indicators (KPIs), on the other hand, are long-term metrics used to gauge progress toward specific performance outcomes. They can be seen as synonymous with the measures used in BSC, as both aim to assess success against strategic objectives. KPIs are often continuous and serve as indicators of whether goals are being met over time. Their strength lies in their ability to monitor sustained progress toward desired results.
Objectives and Key Results (OKRs) function as a tool for setting ambitious, short-term goals. They are typically employed by both organizations and projects to align actions closely with strategic objectives while achieving measurable results. OKRs are written in the SMART format. This framework is well-suited for dynamic environments where agility and responsiveness are essential.
In short, BSC is a framework used to outline and manage strategic initiatives; KPIs are long-term metrics for monitoring performance; and OKRs help in setting short-term goals at an individual level.
By understanding the differences between these three frameworks, organizations can leverage the strengths of each to align their strategies, monitor progress, and achieve both long-term and short-term objectives effectively.
Example: ACME company seeks to grow their customer base.
BSC: Increase the year-over-year growth by 10%.
KPIs: Lead-Conversion Rate, New Customer Rate, Retention Rate, Customer Satisfaction Score, Customer Perception Score.
OKRs: Achieve a 2.5% increase in Lead-Conversion Rate during Q1FY25 by hosting targeted customer engagement events. Improve Customer Satisfaction Score by 5% in Q2FY25 through customer focus groups designed to identify and address pain points. Boost Customer Retention Rate by 10% in Q1FY25 by implementing retention incentives.
Key Definitions
Understanding key definitions related to metric collection and evaluation is critical when analyzing and interpreting data. Clarity in these definitions is essential to ensure that metrics align with organizational goals and foster meaningful insights. Without this precision, the SMART framework loses its effectiveness, leading to suboptimal decision-making and resource allocation.
Leading and Lagging Indicators: It is vital to track both leading and lagging indicators for a robust performance measurement system.
What are Leading Indicators? Leading indicators are predictive metrics that provide insights into future performance. These indicators help anticipate outcomes and guide proactive actions to improve the likelihood of achieving desired results. They are often process-oriented and focus on activities or behaviors that influence outcomes. They predict future trends or results and are actionable, allowing for timely intervention. Example: Number of New Customers, Website Engagement Rates, Production Rate
What are Lagging Indicators? Lagging indicators measure the outcomes or results of previous actions or processes. Reflect past performance and confirm whether objectives have been met. They are retrospective in nature and help assess whether goals have been achieved. While they are useful for evaluating overall performance, they do not provide insights for immediate corrective action. These are useful for evaluation and accountability. Examples: Expenses, Revenue, ROI, Number of Customers
Qualitative and quantitative metrics, when used together, provide a holistic view of any scenario, blending subjective understanding with objective precision.
What are Qualitative Metrics: Qualitative metrics focus on descriptive, non-numerical aspects of data, capturing subjective insights that are often harder to quantify. They provide context, values, and interpretations about behaviors, allowing for a deeper understanding of complex situations. For example, customer feedback gathered through open-ended surveys or interviews provide insights such as "users find the interface intuitive but wish it had more customization options”, which are rich in detail and can guide product improvements.
What are Quantitative Metrics: Quantitative metrics revolve around numerical data and statistical analysis, offering precise and measurable insights. These metrics are essential for tracking performance, identifying trends, and making data-driven decisions. For instance, sales figures, web traffic statistics, or the number of defects in a production line are examples of quantitative data. They help organizations set benchmarks, compare past and present performance, and project future outcomes.
Opportunity vs Units: Understanding the distinction between opportunities and units is fundamental for accurately gathering metrics and addressing customer needs.
The unit represents the tangible item or service that fulfills a customer's request. On the other hand, opportunities encompass the various specifications or attributes associated with that unit, such as its color, size, material, or delivery expectations. Each unit inherently provides multiple opportunities, offering a robust framework to tailor solutions that align with customer preferences and expectations. For instance, consider a GUI Form as a unit. The opportunities within this context include elements like layout, format, typography, and the color palette. Each opportunity serves as a critical specification that enhances the functionality and aesthetic appeal of the UI. By analyzing and optimizing these opportunities, businesses can ensure a more effective and satisfying customer experience, thus driving overall satisfaction and loyalty.
Common Tracking Visual Aids
Visual aids are the foundation of dashboards, making the right graphical selection critical. These visual tools help in understanding performance at a glance, facilitating real-time decision-making and driving actions. A wrong choice can lead to confusion, misinterpretation, or poor decisions. Focus on crafting graphics that convey a clear message and drive impact—avoid the temptation to use flashy but irrelevant visuals. Here are some common visual aids that have a significant impact on messaging:

Conclusion
Effective metric collection and tracking are the cornerstones of informed decision-making and organizational success. By transforming metrics into SMART goals, businesses can ensure clarity, precision, and purpose in their strategies. SMART metrics not only serve as a roadmap for achieving objectives but also foster transparency and accountability at every level. They enable teams to focus on what truly matters, adapt to challenges, and drive continuous improvement. In an ever-evolving landscape, leveraging SMART metrics empowers organizations to stay agile, achieve impactful results, and sustain long-term growth.
Follow the guidelines outlined in this article to effectively define SMART goals and respond with precision and report with impact.